

Measuring Academic Growth for School Accountability
More states should adopt a growth metric that compares students’ progress toward proficiency, not against other students.

Rating schools for both students’ achievement and their progress toward proficiency is a key component of a well-designed accountability system. The best accountability systems prioritize rigorous, criterion‑based growth measures, which appraise each student’s progress toward learning goals. When paired with states’ measures of achievement, these growth measures can ensure that all students are in fact making progress toward proficiency and prevent systems from rewarding low expectations. Yet many states do not use them, electing to use norm-referenced growth measures instead.
The best accountability systems prioritize rigorous, criterion‑based growth measures, which appraise each student’s progress toward learning goals.
Recent national polling shows strong support for annual testing and monitoring of student progress.[1] Voters consistently prioritize foundational reading, writing, and math skills as a means for measuring school effectiveness. When asked to select the two most important pieces of information for rating school performance, respondents most frequently selected academic outcomes measuring grade-level achievement and growth over time.
Many students are not performing at grade level. But while achievement measures will illustrate whether students have mastered grade-level standards, they do not provide a complete picture of a school’s performance. For policymakers to make actionable a belief that all students can learn, their accountability systems must also capture growth.
While achievement measures will illustrate whether students have mastered grade-level standards, they do not provide a complete picture of a school’s performance.
Yet many states’ growth models set low expectations and rely on peer-to-peer comparisons—that is, norm-referenced ones—so that even if students meet expectations each year, their growth may never reach grade-level proficiency. Those students’ schools may still be deemed successful because students are meeting those low expectations, with little connection to whether students are closing the gap to proficiency. Such models reward the appearance of improvement without actually producing it.
Growth models became one of the primary indicators added during the 2011 reauthorization of the Elementary and Secondary Education Act (ESEA). However, the law established no guardrails to ensure that growth models measured meaningful progress toward grade-level proficiency. States eager for relief from proficiency-only accountability systems adopted normative Student Growth Percentiles (SGPs), with limited exploration of alternatives, in part because federal regulations identified SGPs as “approvable.”
Because the SGP model guarantees that approximately 67 percent of students will “Meet” or “Exceed” growth expectations, many states embraced it as a way to present school performance in a more favorable light. Other than political will, today there are no significant barriers preventing states from amending their accountability plans to transition from normative growth to criterion-based approaches.
Today there are no significant barriers preventing states from amending their accountability plans to transition from normative growth to criterion-based approaches.
States differ not only in the growth model they use but also in whether their growth expectations are transparent, comparable over time, and tied to progress toward proficiency. Even when states adopt criterion-based growth models, few states explicitly measure whether a student mastered more grade-level content in the current year than in the previous one.
How Growth Models Work
Criterion-based growth models, such as Growth Toward Proficiency and Value Tables, focus on whether a student is moving closer to meeting or exceeding state expectations. For example, a student who is behind must make a predetermined amount of progress each year to reach proficiency, while a proficient student is expected to move toward advanced performance.
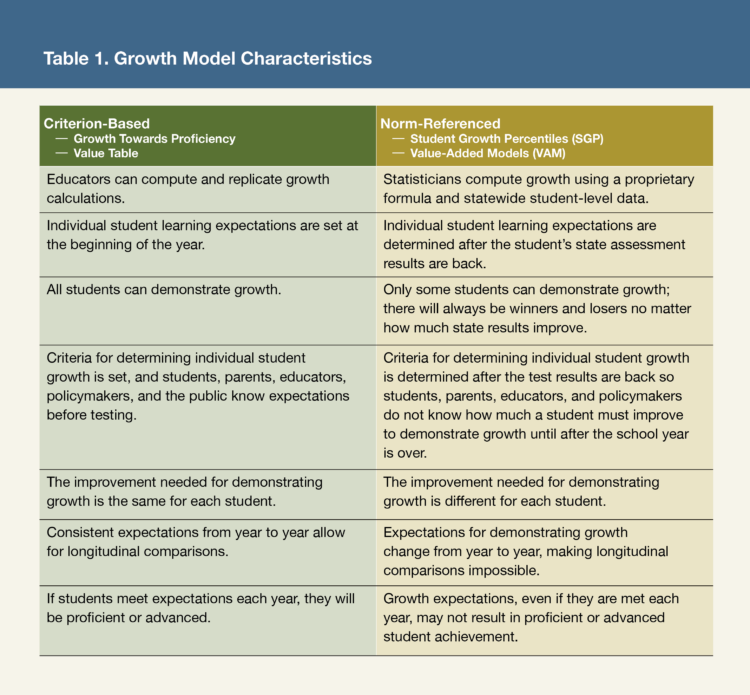
Norm-referenced growth models, such as SGPs and Value-Added Models (VAM), compare students. They assess how a student’s progress compares with that of other students across the state. Thus some students are determined to be “making growth” and others as “not making growth.” Even if every student in the state performs better than last year, some will still be deemed as “not making growth” simply because others improved more. In contrast, all students can demonstrate growth under criterion-based growth models because expectations are clear, consistent, and independent of other students’ performance (table 1).
What Is Fair?
A fair measure of growth holds all students to the same high expectations and ensures that meeting those expectations moves students closer to grade-level proficiency. Growth should reflect meaningful progress toward mastering state academic content standards—not movement defined by peer comparisons or low and shifting expectations.
A fair measure of growth holds all students to the same high expectations and ensures that meeting those expectations moves students closer to grade-level proficiency.
Students who are furthest behind may need the most support to catch up, but the growth model should not suggest that less is expected of them. Instead, schools should provide additional time, instruction, and intervention.
Fairness also depends on administering the same annual statewide assessments in reading and math to all students. Valid, comparable data are the foundation of a strong growth calculation. There is no substitute for uniform assessments that allow true apples-to-apples comparisons across students, schools, and districts.
Valid, comparable data are the foundation of a strong growth calculation.
Balancing Achievement and Growth
Measuring proficiency alone cannot fully reflect a school’s contribution to students’ learning. Good growth measures allow for comparisons across schools and focus on whether they are supporting student learning—regardless of the degree to which differences in student populations are driving outcomes. They give schools credit for helping students who start below grade level make meaningful progress, while also expecting schools with high performers to keep those students advancing. In practice, the growth component should require schools to demonstrate that all students make at least a year’s worth of progress in a year’s time.
States must balance the weight of these measures. In elementary and middle school accountability systems, proficiency and growth should be equally weighted. Overweighting growth can reduce the incentive for ensuring that students reach grade level, while overweighting proficiency can disadvantage schools serving larger numbers of students who enter behind. In high school, however, accountability systems should place greater emphasis on proficiency and postsecondary readiness, with growth playing a secondary role, if included at all.
Overweighting growth can reduce the incentive for ensuring that students reach grade level, while overweighting proficiency can disadvantage schools serving larger numbers of students who enter behind.
While debate continues over the appropriate weighting of achievement and growth indicators, states themselves have largely settled the question in practice. Of the 51 federal school accountability plans reviewed, 47 jurisdictions measure individual student growth.[2] Of those 47, seven states identify schools for improvement through a system of rules rather than an index with prescribed weights.[3] Among the remaining 40 states that use a weighted index system, 33 assign roughly equal weight to achievement and growth—thus treating the two as comparably important.[4]
Growth of the Lowest Performing Students
There is more variance in achievement test scores within a school (80 percent) than across schools (20 percent).[5] That is, in every school there are students in need of intensive support. Effective school accountability systems focus more attention on students with the greatest academic needs without ignoring those that are performing on grade level or higher.
Effective school accountability systems focus more attention on students with the greatest academic needs without ignoring those that are performing on grade level or higher.
States should consider focusing more attention on the lowest-performing students within each school instead of focusing solely on demographic or curricular groups of students. Every school has a group of students performing below grade level that cuts across all socioeconomic and curricular backgrounds. By focusing on low-performing students rather than student groups, the accountability system can directly identify where resources are needed most.
Which Models States Use
When growth first entered federal accountability through a waiver process begun in 2011, states could use models that measured whether students were on track to reach proficiency within a specified time frame or grade. These approaches offered an alternative to the proficiency-only accountability of the earlier law, No Child Left Behind (NCLB). But because the rigorous process required that students make progress sufficient to reach proficiency within three years or by grade 8, few additional students were identified as making growth. Because of this rigor, the model did little to increase the number of schools meeting Adequate Yearly Progress (AYP). As a consequence, the Every Student Succeeds Act (ESSA) in 2015 shied away from clear guardrails to ensure that growth measures reflected meaningful progress toward grade-level proficiency, even as growth became a core component of many state accountability systems (box 1).
Box 1. Parts of State Accountability Systems
A successful system is grounded in five interconnected elements:
- Standards define what students should know and be able to do in each grade and subject.
- Assessments determine whether students have met those standards.
- Accountability uses assessment results to rate schools, ensuring schools are giving kids the opportunity to learn and master all the standards.
- Reporting shares those results and accountability ratings publicly, allowing everyone to see how a school is serving students.
- School improvement is the action educators take based on data from the assessments and accountability system to improve student mastery of the standards.
ESSA requires states to implement all five. When built on clear expectations and transparent data, accountability systems illuminate what is working, identify where change is needed, guide resource allocation, and ultimately ensure that every student is on a path toward grade-level proficiency. But ESSA sets only a floor; there is no bar for rigor. As a result, few states reflect the spirit and intent of school accountability: ensuring all students meet challenging academic standards and improve over time.
Most states moved toward normative models—particularly SGP—partly because federal guidance deemed them acceptable. For states seeking flexibility from proficiency-only systems, SGPs offered a ready-made path, even though they do not directly address whether students are mastering more grade-level content over time.
Most states moved toward normative models—particularly SGP—partly because federal guidance deemed them acceptable.
When states were making these decisions, growth was a new, largely untested concept. Today, our understanding of growth models and their functions has advanced considerably. Before NCLB’s requirement for annual testing, few states had the data necessary to calculate student growth. For the first time, states were receiving annual results for every student and beginning to explore what growth models could measure and how they might be used in accountability systems. Given this context, a model that classified approximately 67 percent of students as meeting or exceeding growth expectations represented a much-welcomed alternative to the highly rigorous proficiency expectations that had left many schools failing to meet AYP. At the time, there appears to have been little consideration of how normative growth models might shape expectations and student outcomes over the long term.
Currently, 31 states use normative models. SGP remains the most common, in use in 22 states, and 9 states use VAM. Only 16 states use criterion-based growth models, but not all 16 set rigorous expectations. Four states do not include individual student growth in their accountability systems at all.[6] Some states, including Florida and Mississippi, use criterion-based methods that award credit only when student growth represents meaningful progress toward grade-level proficiency.
Criterion-Based Growth
Growth Toward Proficiency. This model measures whether a student mastered more grade-level content in the current year than in the prior year. It calculates the change in an individual student’s test score from year to year and compares it with an established expectation. For example, did a student’s fourth grade reading score increase enough by fifth grade to move the student up an achievement level?
Florida, Mississippi, and Louisiana are examples of states that use this measure:
- Florida measures the percentage of students who, from one year to the next, increase to a higher achievement level, increase within levels 1 and 2, remain at level 3 or 4 and had a higher scale score, and remain at level 5.[7]
- Mississippi tracks the percentage of students who, from one year to the next, increase within the lowest three performance levels (e.g., increased from the bottom half of Basic to the top half of Basic), make a higher level, and remained at Proficient or at Advanced.[8]
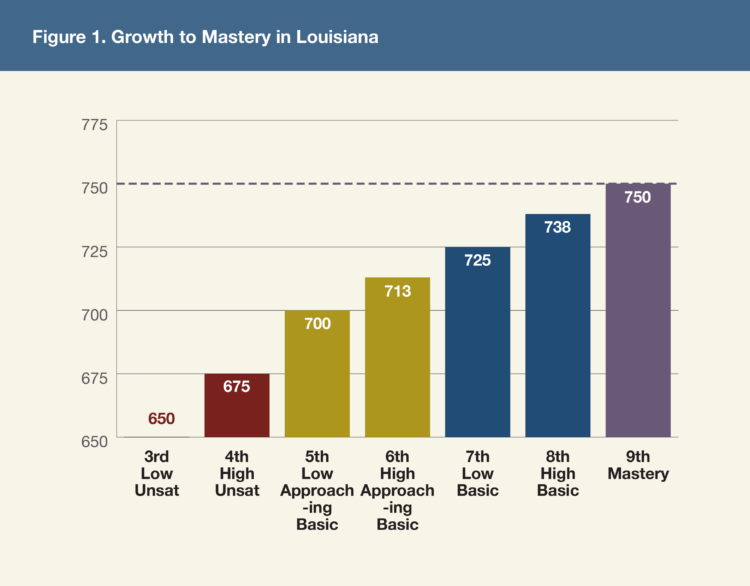
- Louisiana tracks the percentage of students who, from one year to the next, grow from the low to the high half of Unsatisfactory, Basic, and Approaching Basic; improve to the next higher level; grow at least one scale point within Mastery; and remain at Advanced.[9]
If students meet the growth expectations described for Growth Toward Proficiency every year, they will reach grade-level proficiency (figure 1).
Over the past decade, Mississippi has shown what happens when a state takes high expectations seriously. It has moved from one of the lowest performing states for fourth grade reading in 2013 on the National Assessment of Educational Progress (NAEP) to the ninth best in 2024.[10] Math scores also improved, making Mississippi one of the only states to see improvement in all four major NAEP categories.
Over the past decade, Mississippi has shown what happens when a state takes high expectations seriously.
Before its accountability reforms of the late 1990s, Florida ranked in the bottom 10 states. By 2007, Florida was above the national average at grade 4 reading and math and well out of the bottom 10 states at grade 8. Through the 2010s, Florida broke into the top 10 in grade 4 and remains there.
Normative Growth
Student Growth Percentiles. SGP estimates students’ year-to-year growth relative to academically similar peers.[11] Growth expectations are set annually, after the state receives results on the state summative tests. Because growth is judged relative to that of other students and not predetermined expectations, the distribution of students making growth and not making growth remains the same.
Imagine a student, Steve, who scored 300 on last year’s fourth grade math test. This year, Steve scored 350 on the fifth grade test—50 points better. When Steve’s SGP is compared to all other students’ improvement who also scored 300 on last year’s fourth grade math test, he bested 70 percent of his peers. His SGP is the 70th percentile. Roger also improved 50 points, but he only scored better than 30 percent of his academic peers who scored 200 in fourth grade.
Steve and Roger both improved by 50 points, but their improvement is classified differently because each is compared with a different group of academic peers. Additionally, expectations for growth change yearly, meaning a 50-point gain next year may not correspond to the same percentile as in the current year (table 2).
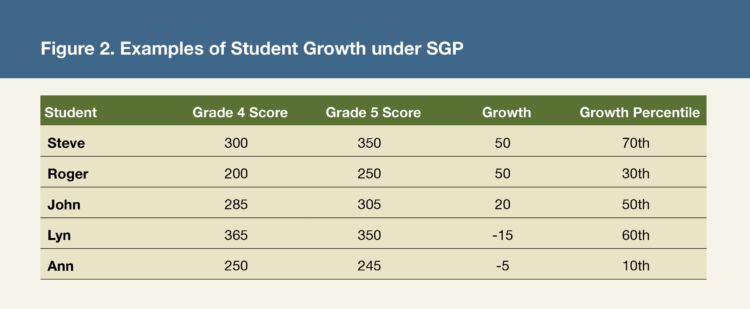
Further, measuring growth on a comparative basis does not ensure that the accountability system captures students’ progress toward proficient or advanced achievement. In the example, Lyn’s score decreased from the prior year, yet she is still classified as improving, since she performed better than 60 percent of her peers who scored 365 in the previous year.
Measuring growth on a comparative basis does not ensure that the accountability system captures students’ progress toward proficient or advanced achievement.
In states using SGP, student achievement could actually be improving substantially. However, because growth is measured relative to how well students are growing statewide, the number of students deemed to not be growing remains the same. Likewise, substantial declines in student achievement during a school year mean that student performance is decreasing, but the number of students deemed to be growing remains the same because some students will decline less severely than others.
During the COVID period, student performance in all states decreased. However, states using normative growth measures demonstrated that schools still had the same percentage of students exceeding and meeting growth expectations. The expectation for meeting growth in many cases were negative values—schools were earning credit for students making growth even though they were regressing in content mastery, albeit at a rate less than that of their peers.
Normative Growth
Value-Added Model. Used in nine states, VAM estimates the portion of a student’s year-to-year growth that is attributable to the school. The models estimate how much each student is expected to learn annually based on past performance and, in some cases, other factors such as age, gender, coursework, disability status, class compositions, and attendance (table 3). These values are recalculated each year by grade and subject and vary based on student outcomes in that year.
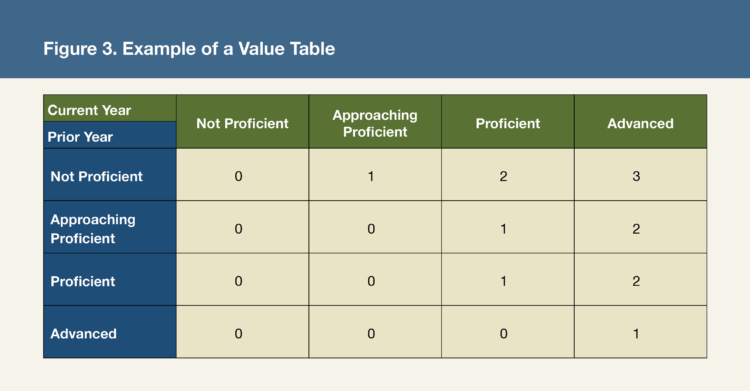
A student’s current performance is then compared with predicted, or expected, performance to estimate how much “value” the school added. A phenomenon that causes concern with VAM is when a score decrease is expected. When a student’s predicted performance is lower than both current and prior performance, a school is credited with growth even when a student performs worse in the current year than in the preceding one.
Further, schools earn credit only for growth that exceeds expectations, not for the full amount of growth a student makes during the school year.
National Achievement by Policy Era
Because it includes national samples of students, NAEP provides a lens for evaluating how accountability policy design has influenced US student outcomes over time. Table 4 illustrates score trends across four eras, broken out by student group: pre-NCLB (1992–2000), NCLB (2000–2011), ESEA waivers and ESSA (2011–19), and COVID (2019–24).
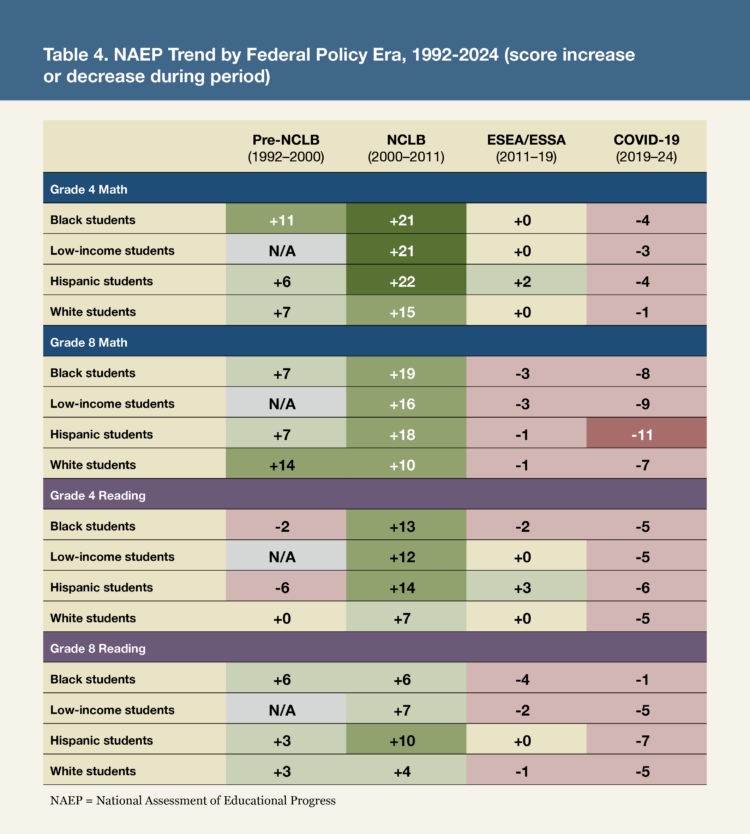
What the figures make apparent is that the most significant improvements took place when student proficiency for the purpose of school accountability predominated. Under NCLB in the early 2000s, schools were expected to have all students reach proficiency in reading and math and held to the same grade-level expectations—student growth was not a factor. While states did not reach 100 percent proficiency, they made their greatest improvements, narrowed achievement gaps, and came closer to that goal than at any time thereafter. This data further supports placing weight on proficiency and ensuring the growth model measures student achievement toward proficiency.
Conclusion
America’s K-12 public school students spend more than 60 billion hours in the classroom every year, supported by $950 billion in public investment—and constitute states’ largest expenditure.[12] The impact of this commitment is felt beyond the walls of any classroom. It shapes workforce readiness, economic growth, national security, and the strength of civic institutions. When state boards of education usher in well-designed accountability systems, they ensure that schools are producing meaningful returns on that investment and that schools improve over time.
When state boards of education usher in well-designed accountability systems, they ensure that schools are producing meaningful returns on that investment and that schools improve over time.
As states continue refining accountability systems, growth measures remain an important consideration in balancing clear expectations, recognition of student progress toward proficiency, and transparency for families and policymakers alike. State boards should ensure that the growth measure in their systems achieve these ends.
Christy Hovanetz, Ph.D., is a senior policy fellow at ExcelinEd, a national organization that supports state leaders and policymakers to advance student-centered K-12 education policies with a focus on educational quality, innovation, and opportunity.
Notes
[1] Patricia Levesque, “What Americans Want: New Polling Reveals Support for Student-Centered Education Policies,” blog (ExcelinEd, December 19, 2025).
[2] Only California, Kansas, Kentucky, and Oregon do not.
[3] New Hampshire, Pennsylvania, New York, Maine, Nebraska, West Virginia, and Minnesota.
[4] A full analysis and methodology is forthcoming from ExcelinEd in November 2026 via SchoolAccountabilityMatters.org.
[5] Michael C. Rodriguez and Kyle Nickodem, Comprehensive Partitioning of Student Achievement Variance to Inform Equitable Policy Design, paper presented at the annual meeting of the National Council on Measurement in Education, New York City, April 18.
[6] Growth Toward Proficient is in use in Alaska, District of Columbia, Louisiana, Florida, Nebraska, West Virginia, Mississippi, Michigan, and Idaho. Value Added is used by Arkansas, Montana, Tennessee, North Carolina, Virginia, Ohio, Missouri, Pennsylvania, South Carolina. Value Tables are used in Delaware, Connecticut, Maine, Texas, Minnesota, Oklahoma, Vermont. SGP states are Georgia, Illinois, Massachusetts, Maryland, Arizona, Colorado, New Hampshire, New Jersey, North Dakota, Utah, Nevada, Rhode Island, Wyoming, New York, Iowa, New Mexico, South Dakota, Alabama, Hawaii, Washington, Wisconsin, and Indiana. Kansas, Oklahoma, Kentucky, and California do not use a growth model for federal accountability.
[7] Florida Department of Education, “2024–25 Guide to Calculating School Grades, District Grades, and the Federal Percent of Points Index” (September 2025).
[8] Mississippi Department of Education, Mississippi-Public-School-Accountability-Standards-2025.pdf (January 2026).
[9] Louisiana Administrative Code, Title 28, Part XI. Accountability/Testing, Subpart 1. Bulletin 111—The Louisiana School, District, and State Accountability System.
[10] The Nation’s Report Card, National Assessment of Educational Progress, State Profiles, State Comparisons.
[11] Katherine E. Castellano and Andrew D. Ho, “A Practitioner’s Guide to Growth Models” (Council of Chief State School Officers, February 2013).
[12] US Department of Education, Institutes of Education Sciences, Common Core of Data, Revenues and Expenditures for Public Elementary and Secondary Education: School Year 2022–23 (Fiscal Year 2023), 2025-302 (April 2025).
Also In this Issue

How State Board Leaders Can Build Next-Generation Accountability
By Morgan Scott Polikoff and Rachel AndersonCoherence in state policies plus aligned supports to districts pave the way forward.

Data for Improvement and Data for Accountability: Considerations for State Boards
By Elaine AllensworthCarefully designed accountability systems can spur schools to improve; others can undermine improvement and equity.

Making Room for What Matters: How State Boards Can Support Innovation in Accountability
By David Nitkin, Chelsea Waite, and Janette AvelarThe voices of school leaders who are most actively pushing the school improvement envelope can help shape the accountability conversation.

Measuring Academic Growth for School Accountability
By Christy HovanetzMore states should adopt a growth metric that compares students’ progress toward proficiency, not against other students.

How State Leaders Can Support Local Innovation and Improvement
By Jennifer Lin Russell, Donald J. Peurach, and Jennifer Zoltners ShererBy backing educational improvement networks, they can foster collaborative inquiry and experimentation.
 i
i
 i
i
 i
i