

Data for Improvement and Data for Accountability: Considerations for State Boards
Carefully designed accountability systems can spur schools to improve; others can undermine improvement and equity.

In adopting state accountability systems, state boards of education aim to further student learning by building education systems where young people meet state learning standards and show they are headed for success in their education, careers, and lives. By choosing indicators for accountability, state board members draw attention to particular data points, ensuring they are a priority for schools. At the same time, if actionable strategies for educators do not accompany those metrics, then accountability systems are simply labels, not tools for improvement.
Accountability metrics on their own cannot fuel improved student learning and outcomes. The fuel that drives school improvement is the data that school leaders, teachers, and staff use throughout the school year as they work to better serve their students and meet the expectations states have set. If state boards choose accountability metrics that are aligned and responsive to school-based efforts to improve instruction and learning, they can build a strong educational ecosystem with clear incentives and levers for improvement.
The fuel that drives school improvement is the data that school leaders, teachers, and staff use throughout the school year.
The Properties of Data for Improvement
Data vendors and researchers often talk about the quality of the data they produce in terms of reliability and validity. Reliability tells you if the data is sufficiently consistent and error-free. Validity tells you the degree to which data represent what you think it does. These are important properties for accountability data. When using data for improvement, other properties matter just as much or more: timeliness, clarity, malleability, and predictive power.
Timeliness. To get different and better outcomes, educators must change students’ experiences. Thus, it is absolutely necessary to change adult behaviors, school systems, or classroom strategies. Change involves uncertainty and risk. In a complex social system like a school, you cannot know with certainty what will happen when you make a change. Even programs with demonstrated evidence of effectiveness in one place are far from guaranteed to work in another. The sooner educators get feedback on their changes, the sooner they can adjust course.
In a complex social system like a school, you cannot know with certainty what will happen when you make a change.
Accountability metrics tend to come out once a year. By representing performance across an entire school year, they are more stable and reliable than metrics that come out multiple times in a year. That gives state policymakers and the public a big-picture view of school performance and allows them to observe general trends and patterns. But these data are not timely enough for improvement. If school staff have to wait a year each time they try a new strategy, it will take a long time to learn whether and how they need to modify their efforts, and it will be too late for their students in the current school year. It also puts a lot of pressure on that year’s new strategies to work.
Metrics available by month, quarter, or semester let educators change course throughout the school year rather than just hoping the numbers will look better by year’s end. Practical data that are collected in the running of a school—days absent, quarter term grades, classroom observations, curriculum assessment results—can provide those timely data, although they need to be organized in a way that helps educators see patterns. Cleaning and reporting the data to enable this use, however, takes time and resources. School staff can also do mini data collections through such means as surveys, student focus groups, and collection of student work to focus on particular goals.
Metrics available by month, quarter, or semester let educators change course throughout the school year.
Schools and districts often have lots of data, but they lack both the mechanisms to pull these data together and the bandwidth to convene teams around them. State boards can support schools working toward improving performance on accountability metrics by supporting knowledge sharing among districts on how to collect, organize, and analyze data and teams around timely data that leads to real changes in school practices and students’ experiences.
Clarity. Accountability metrics may have some level of abstraction in order to meet other criteria—such as assessing school performance fairly. For improving practice, educators need data that are easy to gather and understand.
Take a common debate between teachers and administrators about using assessment data to guide instruction. While administrators often ask their teachers to use standardized test scores to guide practice—because the data are known to be reliable and highly aligned with end-of-year assessment results—teachers push back that the standardized scores are not useful. In fact, scores on standardized tests are often too abstract to guide mid-year changes in practice. They are a probability of what a student is likely to be able to do, given their score, not a precise diagnostic of what students can and cannot do. And they are designed to be curriculum neutral, while learning is inherently contextual. In contrast, curriculum-based assessments provide information on specific skills, asked in ways that are consistent with how students were taught the curriculum. They provide much more concrete, detailed information to guide instruction.[1]
Curriculum-based assessments provide information on specific skills, asked in ways that are consistent with how students were taught the curriculum.
Likewise, high school graduation rates result from the cumulation of students’ experiences throughout K-12. What needs to change to increase the rate? It is hard to say, which makes it a difficult metric for schools to work on improving. But those many factors affecting high school graduation do so by affecting whether students pass their high school courses. Course grades and failures are something that school staff can easily monitor and develop strategies around because they are directly tied to school practices. Educators can use monthly or quarterly reports of students getting Ds and Fs to develop and test strategies for preventing course failure, which will eventually lead to more students graduating.[2]
Malleability. Malleability reveals how likely the data are to change when conditions change—that is, how much the metric can actually move when schools do their strongest work.
When school staff put a lot of effort into trying to change data points that are resistant to change, it can lead them to think their efforts are pointless. In contrast, when school staff see their efforts pay off with stronger performance, they are motivated to keep working to improve.
When school staff see their efforts pay off with stronger performance, they are motivated to keep working to improve.
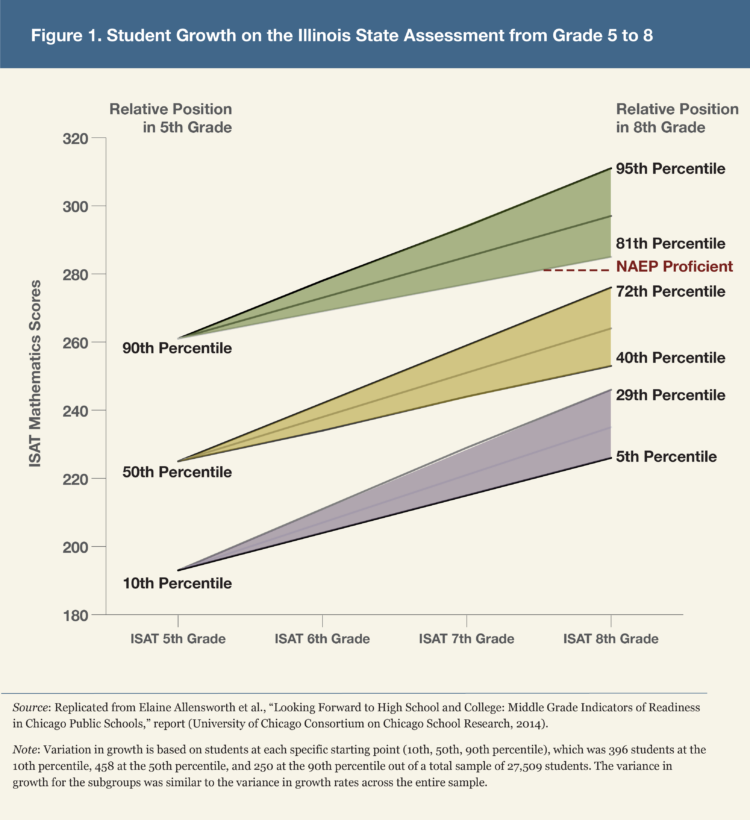
Consider the malleability of standardized test scores, particularly metrics around whether students pass a particular proficiency point. Standardized assessments can provide useful information about broad trends in achievement and can help identify students who may need additional support. At the same time, their properties do not make them useful for continuous improvement. Outside of the early primary grades, students’ scores on standardized assessments change very little from year to year relative to the differences that exist among students in each grade.[3] So even with the strongest instructional practices and interventions, it might not be possible for educators to increase students’ scores by much (figure 1).
Figure 1 shows the range of growth over three years in state mathematics scores in Chicago for students who were at the 10th, 50th, and 90th percentiles in fifth grade. Among students who started at the 50th percentile in fifth grade, even those with the highest growth did not reach proficiency standards on the National Assessment of Educational Progress (NAEP) by eighth grade. Students with the highest growth did move from the 50th to the 72nd percentile in the district, but a metric based on meeting NAEP proficiency would be unable to capture their exceptional performance.
In general, at schools that make the strongest growth in the country (at the 90th percentile), gains are about 20 percent higher than average. That means it would take five years of the most exceptional growth for a school to bring students who started out one year behind to catch up to average scores.[4] Thus a school could substantially improve students’ learning experiences and raise their test scores but still see almost no movement in the percentage of students meeting proficiency standards, just based on how many students were close to the benchmark to start. If that was the metric a school was using to judge whether their efforts were working, they might think they were making no progress when they were actually making exceptional gains. While NAEP proficiency is not the benchmark most states use, the same principle applies to other assessment benchmarks and some growth-to-proficiency metrics.
Malleability should be a strong consideration when choosing data metrics both for improvement work in schools and for accountability. If the metrics used for accountability are unlikely to change, or they change so little that schools have little chance to meet expectations even with strong practice, then schools are set up for failure from the beginning. And if the data barely change even with the strongest practices, those particular metrics are not sufficiently sensitive to guide improvement. This critical issue often gets overlooked. Vendors that produce data rarely provide sufficient information on the degree to which change is possible, given the strongest improvements in practice. But it is essential for setting meaningful goals and expectations for schools.
Malleability should be a strong consideration when choosing data metrics both for improvement work in schools and for accountability.
Predictive Power. Researchers call this predictive validity—evidence that a measure forecasts a later outcome. Data used for accountability should be meaningful for the state’s long-term vision for students, tied to meaningful outcomes. Accountability metrics have to predict later outcomes (like college and career success) or represent outcomes that are truly meaningful for students, their families, and the community in the present day (such as feelings of safety and belonging in school). Otherwise, it is a waste of precious student and teacher time and resources to work toward those metrics. Likewise, the data used in schools for within-year improvement should be predictive of the metrics used in accountability. How certain are state board members that the metrics in their accountability systems are predictive of the goals set in their vision for how schools are supporting students? Often, policymakers use metrics they think are important, but the evidence of their importance is weak. Before adopting or retaining an indicator, boards can ask for explicit evidence of how strongly it predicts the student outcomes in their state’s vision. That requires getting data and evidence linking the indicator to the goals the state is trying to reach.
Data used for accountability should be meaningful for the state’s long-term vision for students, tied to meaningful outcomes.
Where evidence is scant—for career readiness, for example—retaining that goal might necessitate sponsoring research involving cooperation across state agencies. At the same time, for the purpose of improvement, individual schools and districts might develop relationships with employers to get feedback on the success of their graduates.
In other cases—where a vendor supplies the data, for example—board members may need to interrogate the evidence provided. Returning to the “percent proficient” statistics: Maybe a state uses that data as an indicator that students are on track to college and career success. If the metric is aligned with SAT or ACT benchmarks and if students reach the proficiency benchmarks, they have a 70 percent chance of getting a “C” or better in a first-year college course. That sounds good. But what is the probability if they do not reach the benchmarks? What if they just miss it, or are a year behind? Or two years behind? One cannot gauge the indicator’s predictive power without knowing how the probability of success changes by meeting the goal versus not meeting it. Yet those data are not clearly provided. According to the College Board, the average college freshman GPA for students who meet the benchmarks (with scores up to 2.4 years of growth above the benchmark) is a 2.88 (B–) while for those who do not (with scores just below to 2.7 years below the benchmark) is a 2.50 (C+).[5] There is a difference in their college outcomes, but college success is not strongly defined by whether students meet the benchmark. That calls into question its use as an indicator of college readiness for accountability purposes.
Or consider high school graduation rates. High school graduation is one of the strongest predictors of life outcomes of any indicator that exists—predicting earnings, college completion, and even how long a person is likely to live.[6] Yet in recent years, there have been concerns that the meaning of a diploma has changed, with grades increasing while test scores and attendance have declined. Rather than assuming high school graduation has the same meaning or that it does not, state leaders could call for research showing whether its predictive power for key outcomes has changed, like its relationship with earnings after high school.
High school graduation is one of the strongest predictors of life outcomes of any indicator that exists—predicting earnings, college completion, and even how long a person is likely to live.
Implications for Accountability Metrics
Accountability metrics can help spur improvements in schools if they are carefully designed to do so. They provide a clear north star for principals, teachers, and district leaders to reach for. They can bring attention to outcomes that might otherwise be lost amid competing demands on schools. They can be used to make success visible, so that schools that are most effective at supporting student learning are recognized—and can teach the rest of us what is possible and what works.
If an accountability metric is intended to foster improvement in schools, it needs to have some similar characteristics to data for improvement in schools, but it need not be identical. Data should be malleable enough that schools can show improvement and reach the goals that are set for them with strong effort. And data need to be predictive of the goals that states ultimately want for their students, or they will distract attention and work away from goals that are truly desired.
Data should be malleable enough that schools can show improvement and reach the goals that are set for them with strong effort.
Accountability metrics do not need to be as timely nor as specific as data used in schools. The metrics do not need to be available throughout the year, as they are something to aim for at the end of the year, and to study when making plans for the next year. Their meaning should be clearly communicated, but can be more complex, for example, capturing performance in a wide range of areas or ensuring the metric is fair when applied to schools in different contexts.
Should Improvement Data Be Public?
Data for improvement work best when they are used in settings where people can be honest about problems, learn from mistakes, and try new approaches without feeling like they are under a spotlight. When information that might reveal a weakness is also a public accountability measure, the natural response is to protect oneself from the data rather than to lean in with curiosity. It is easy to become dismissive and say the data are flawed. It can also lead to practices that are shortcuts to better data reports without meaningfully improving students’ educational experiences. Keeping data for improvement out of the public eye and out of accountability provides important space to try new strategies and be reflective.
When information that might reveal a weakness is also a public accountability measure, the natural response is to protect oneself from the data rather than to lean in with curiosity.
What Can State Boards Do?
State boards shape the incentives, language, and structures that define what data mean in a state system through the indicators they adopt, the weights they assign them, and the guidance they give districts on data use.
State boards can require that any proposed accountability indicator come with evidence on both its predictive relationship to long‑term outcomes and its observed malleability across schools or districts, whether they are educational attainment milestones, course performance, attendance, climate, or measures of academic growth. Boards can ask the suppliers of data to provide clear evidence about the metrics they use in accountability and the data systems they support in districts. They can ask researchers to conduct analyses showing the malleability and predictiveness of the data that they ask schools to work toward. In short, state boards can insist that every indicator in their accountability systems earns its place.
Boards can ask the suppliers of data to provide clear evidence about the metrics they use in accountability and the data systems they support in districts.
Boards also can be more intentional about how goals are set. The long-term vision for students should be ambitious. But annual accountability targets should be grounded in evidence about what can realistically change. If schools are given goals that are unattainable even with strong practice, then the accountability system stops functioning as a source of direction and leads to discouragement. State boards can set expectations that recognize meaningful progress from different starting points while still keeping attention on equity and long-term student success.
Another important role for state boards is to protect space for school-level improvement work. That means resisting the impulse to pull every useful local indicator into the public accountability system. Boards can reinforce this distinction in policy guidance and communication, making clear that some data are designed for internal learning and action, not external judgment. This can help reduce incentives to manipulate internal indicators and support more honest use of data in schools.
Another important role for state boards is to protect space for school-level improvement work.
State boards can also use their policy and convening authority to support the conditions under which improvement is more likely. Data do not improve schools on their own. First, the sea of data collected in schools needs to be presented in a way that allows for thoughtful interrogation. Schools often lack the manpower and the expertise to pull together data reports that are useful. States can help schools and districts develop data reporting systems so they do not need to find or develop that capacity on their own. Second, improvement requires time for teachers and school leaders to meet, interpret information together, plan responses, and monitor the results. Boards can elevate the importance of collaboration time, support leadership development around data use, and encourage and support districts to build structures that help school teams work productively with evidence rather than simply comply with reporting requirements.
State boards can also use their policy and convening authority to support the conditions under which improvement is more likely.
Finally, boards matter in the way they talk about schools and data in public. When board deliberations focus only on whether a number went up or down, they communicate that the number itself is the goal. When they ask what the metric represents, what conditions may be producing it, and what strategies are helping schools improve, they model a more constructive use of data. Federal law requires states to report some indicators, which shapes what accountability systems emphasize, but leaves discretion over which specific indicators to adopt, how heavily to weight them, and how to describe them publicly. Boards can be clear about what the data can say and what they cannot and how the metrics are used as part of a broader system of support. The choices state boards make for accountability metrics define whether data will function merely as labels or as useful tools for building the kinds of schools and opportunities that families and educators want for students.
Elaine Allensworth is a research professor at the University of Chicago Consortium on School Research and author of Using Data to Improve Schools.
Notes
[1] Scott F. Marion, James W. Pellegrino, and Amy I. Berman, eds., Reimagining Balanced Assessment Systems (National Academy of Education, 2024).
[2] Elaine Allensworth, “The Use of Ninth-Grade Early Warning Indicators to Improve Chicago Schools,” Journal of Education for Students Placed at Risk (JESPAR) 18, no. 1 (2013): 68–83, https://doi/abs/10.1080/10824669.2013.745181.
[3] Howard S. Bloom et al., “Performance Trajectories and Performance Gaps as Achievement Effect-Size Benchmarks for Educational Interventions,” Journal of Research on Educational Effectiveness 1, no. 4 (2008): 289–328; Nathan Dadey and Derek C. Briggs, “A Meta-Analysis of Growth Trends from Vertically Scaled Assessments,” Practical Assessment, Research and Evaluation 17, no. 14 (2012): n. 14; Elaine Allensworth, Using Data to Improve Schools (Corwin Press, 2025), chapter 3.
[4] Elliot Regenstein, Ben Boer, and Paul Zavitkovsky, “Establishing Achievable Goals: Recommendations for Improved Goal-Setting under the Every Student Succeeds Act” (Advance Illinois, December 2018).
[5] SAT validation data come from figure 1 of P. A. Westrick et al., “Validity of the SAT® for Predicting First-Year Grades and Retention to the Second Year,” research paper (College Board, May 2019). See Allensworth, Using Data, for details.
[6] US Department of Health and Human Services, Office of Disease Prevention and Health Promotion, “High School Graduation,” literature summary (N.d.)
Also In this Issue

How State Board Leaders Can Build Next-Generation Accountability
By Morgan Scott Polikoff and Rachel AndersonCoherence in state policies plus aligned supports to districts pave the way forward.

Data for Improvement and Data for Accountability: Considerations for State Boards
By Elaine AllensworthCarefully designed accountability systems can spur schools to improve; others can undermine improvement and equity.

Making Room for What Matters: How State Boards Can Support Innovation in Accountability
By David Nitkin, Chelsea Waite, and Janette AvelarThe voices of school leaders who are most actively pushing the school improvement envelope can help shape the accountability conversation.

Measuring Academic Growth for School Accountability
By Christy HovanetzMore states should adopt a growth metric that compares students’ progress toward proficiency, not against other students.

How State Leaders Can Support Local Innovation and Improvement
By Jennifer Lin Russell, Donald J. Peurach, and Jennifer Zoltners ShererBy backing educational improvement networks, they can foster collaborative inquiry and experimentation.
 i
i
 i
i
 i
i